Cpm is yet another interesting process capability metric that is not very popular. In fact it is more robust than Cpk.
Cpm is an advanced measure and it corrects some deficiencies in Cpk. It is also called as Taguchi Capability Measure. In order for us to understand Cpm, let’s take a step back and understand Cpk.
Cpk
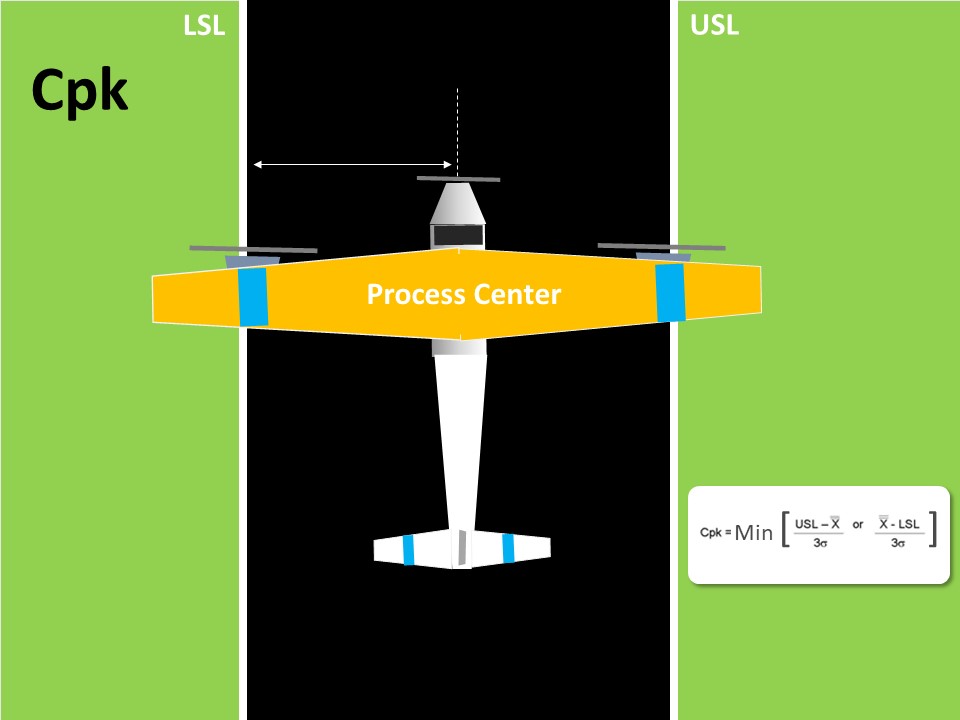
Cpk is considered as a measure of the process centering. If you closely observe the Cpk formula, it doesn’t take the actual Target value. Target Value is the center value obtained from customer specification.
However it takes the lowest value of (USL – Process Mean) and (Process Mean – LSL). In a way, this is an indirect method of assessing if the process centered to the tolerance.
As an analogy, in order to know if the plane is landing exactly on the middle of the landing strip, we look at the distance of the plane’s nose from either edge of the strip. That is good but it’s only an indirect way of assessing the process center.
Now it’s look at Cpm and then draw comparisons.

Cpm
If you look at the formula of Cpm, it contains the target value. Thus in addition to obtaining the USL and LSL from the customers, we also obtain the Target value.
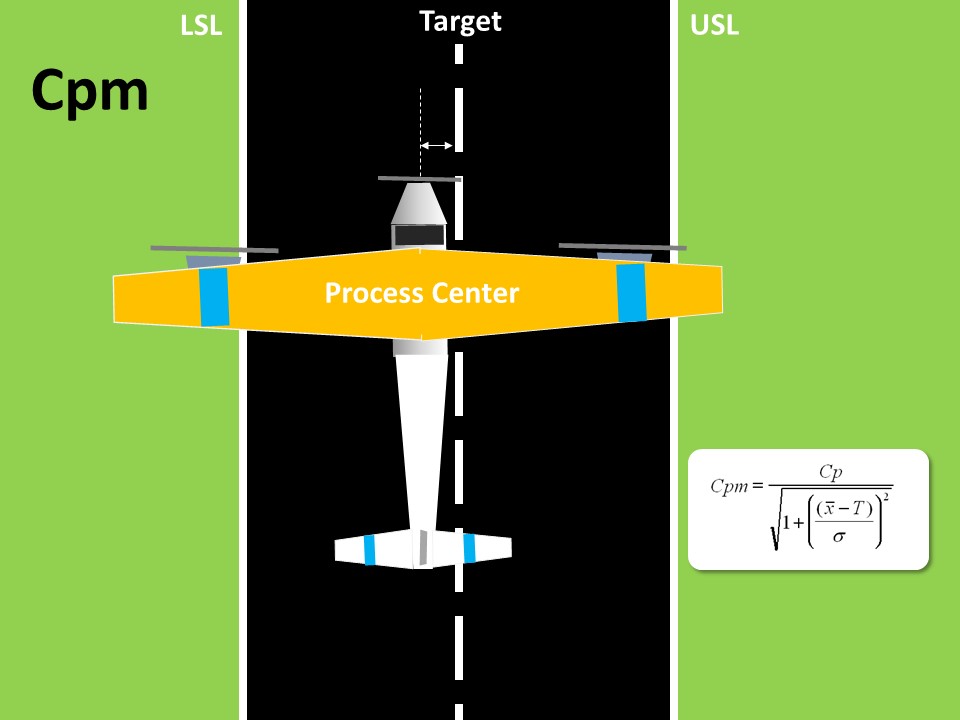
This means, Cpm is a true process centering capability index, because it compares the difference between process mean and target value. To draw an analogy to plane landing, we are comparing the plane nose to the median line of the strip.
Let’s now take a few scenarios to compare Cpk and Cpm values.
Cpk and Cpm Scenario 1
Process is centered, mean and target are close to each other. Cpk and Cpm are high and nearly the same.

Cpk and Cpm Scenario 2
Process is not centered and Cpk & Cpm both have reduced.

Cpk and Cpm Scenario 3
Process is centered but tolerance is liberal. Thus Cpk and Cpm values are very high.

ScCpk and Cpm Scenario 4
Out here, the process has liberal tolerance but a meagre shift from the target. In this scenario Cpk value hasn’t really dropped much, but Cpm has crashed down. While this example is an extreme scenario with very liberal tolerance, it’s meant to illustrate the fact that Cpm is very sensitive to even small shift in mean from center, while Cpk isn’t.

Cpk and Cpm Scenario 5
In this case, there is only a specification on one side. In most business processes, Service Levels have only an upper or lower specification. In some cases, Cpk looses its significance. However, in all service scenarios, there is a target value. For ex: customers are told that payment will be updated in 4 hours but the internal target is to get it done in 2 hours. Process is capacitized for 2 hours. In also such scenarios Cpm will be a relevant centering metric.

In this scenario, Cpk is high but Cpm isn’t. This Cpm is a good capability measure for one sided tolerances.
Cpk and Cpm Scenario 6
This is a unique case, where the Target isn’t the center of tolerance. This situation can occur in process industries and for certain critical dimensions where we intentionally set the process not at the center but to one side (such as to offset for tool wear in grinding).

From the above 6 scenarios, it is clear the Cpm is a robust process centering capability index which can be used to evaluate process shifts, drifts, one-sided specifications and non-centered specifications.
To further get some hands-on practice, try drawing the following values in paper and then calculated CpK and Cpm.
usl = 30, lsl = 6, Target = 18, Mean = 10, SD = 0.6
Tags
Analyze Phase of Lean Six Sigma Project is the third phase. Following are the deliverable of this phase that Six Sigma Green Belt should deliver with her team:
- Statistically validate root causes
- Perform Value Stream Mapping & Process Value Analysis
- Control & Impact Matrix
Statistically Validate Root Causes
The data that has been collected in the Measure Phase is used to draw statistical associations between CTQ measures and causes. The causes that are statistically significant are the root causes. There are a variety of statistical tools to establish this association. Depending on the type of data – continuous or discrete – tools are selected. Such tests are generally called as Hypothesis tests. 2-t Test, Z-test, t-test, ANOVA, Chi-Square Test, Correlation, Regression, etc., are few common hypothesis tests.
The procedure to perform, and interpret all the above tests are usually covered in detail in Lean Six Sigma Green Belt Training programs.
Perform Value Stream Mapping & Process Value Analysis
Value Stream Mapping (VSM) is a popular tool used in Lean methodology; as an alternate approach to statistically identifying Root Causes, or in conjunction with it is the application of Value Stream Mapping and Process Value Analysis. It is used to identify the 7 types of Wastes (Muda – in Japanese) in a process. VSM is a holistic method to visually document the way in which value is getting built in a process.
The 7 types of process wastes are generally referred to as Non-Value Added tasks in conventional Six Sigma. The procedure of associating every task in a process as either Value Adding (VA), Non-Value Adding (NVA), or Value-Enabling (VE) is called as Process Value Analysis.
These methods are very useful in projects where extensive data collection is not possible, or in projects with Turn-Around Time or Delay reduction.
Control-Impact Matrix
The final deliverable of the Analyze phase is to summarize all the findings from Statistical validation or Process Value Analysis (& VSM) in a 2×2 matrix called as Control-Impact Matrix. It is important to ensure that the project doesn’t end up as an academic exercise or research study. Hence, the Lean Six Sigma team needs to identify root causes which have high impact, and well within the control of the team. This is done through a team discussion with the involvement of the project sponsor.
Once the root causes have been identified, & a formal Analyze Tollgate review is completed; the Lean Six Sigma Project is ready to move to the Improve Phase. Next >>>
Tags
Related Articles
Analyze Phase of Lean Six Sigma Project is the third phase. Following are the deliverable of this phase that Six Sigma Green Belt should deliver with her team:
- Statistically validate root causes
- Perform Value Stream Mapping & Process Value Analysis
- Control & Impact Matrix
Statistically Validate Root Causes
The data that has been collected in the Measure Phase is used to draw statistical associations between CTQ measures and causes. The causes that are statistically significant are the root causes. There are a variety of statistical tools to establish this association. Depending on the type of data – continuous or discrete – tools are selected. Such tests are generally called as Hypothesis tests. 2-t Test, Z-test, t-test, ANOVA, Chi-Square Test, Correlation, Regression, etc., are few common hypothesis tests.
The procedure to perform, and interpret all the above tests are usually covered in detail in Lean Six Sigma Green Belt Training programs.
Perform Value Stream Mapping & Process Value Analysis
Value Stream Mapping (VSM) is a popular tool used in Lean methodology; as an alternate approach to statistically identifying Root Causes, or in conjunction with it is the application of Value Stream Mapping and Process Value Analysis. It is used to identify the 7 types of Wastes (Muda – in Japanese) in a process. VSM is a holistic method to visually document the way in which value is getting built in a process.
The 7 types of process wastes are generally referred to as Non-Value Added tasks in conventional Six Sigma. The procedure of associating every task in a process as either Value Adding (VA), Non-Value Adding (NVA), or Value-Enabling (VE) is called as Process Value Analysis.
These methods are very useful in projects where extensive data collection is not possible, or in projects with Turn-Around Time or Delay reduction.
Control-Impact Matrix
The final deliverable of the Analyze phase is to summarize all the findings from Statistical validation or Process Value Analysis (& VSM) in a 2×2 matrix called as Control-Impact Matrix. It is important to ensure that the project doesn’t end up as an academic exercise or research study. Hence, the Lean Six Sigma team needs to identify root causes which have high impact, and well within the control of the team. This is done through a team discussion with the involvement of the project sponsor.
Once the root causes have been identified, & a formal Analyze Tollgate review is completed; the Lean Six Sigma Project is ready to move to the Improve Phase. Next >>>