Cpm is yet another interesting process capability metric that is not very popular. In fact it is more robust than Cpk.
Cpm is an advanced measure and it corrects some deficiencies in Cpk. It is also called as Taguchi Capability Measure. In order for us to understand Cpm, let’s take a step back and understand Cpk.
Cpk
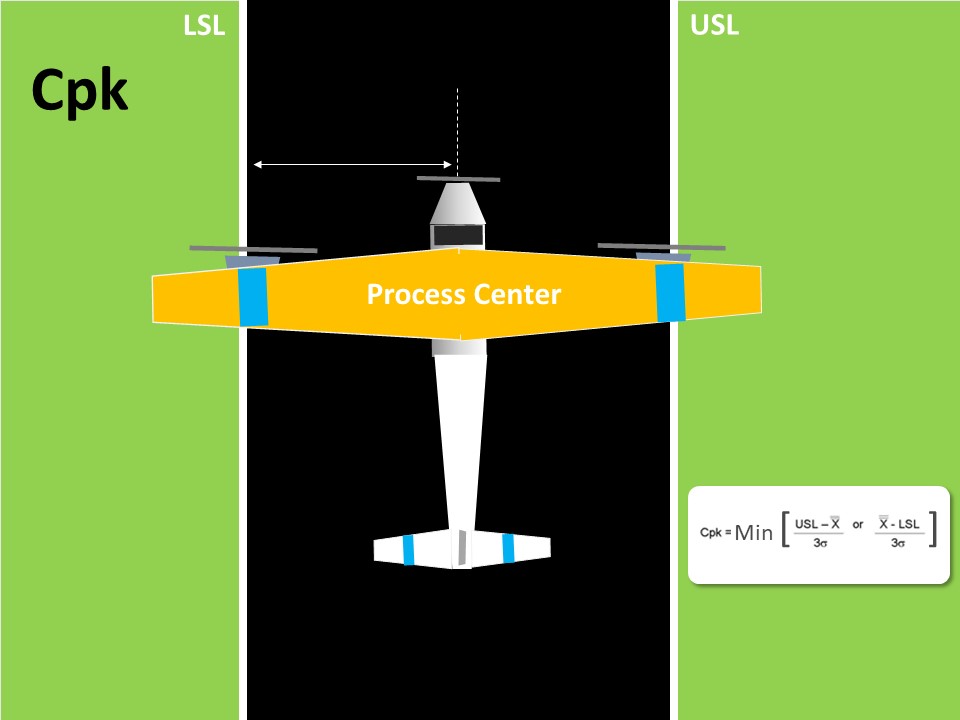
Cpk is considered as a measure of the process centering. If you closely observe the Cpk formula, it doesn’t take the actual Target value. Target Value is the center value obtained from customer specification.
However it takes the lowest value of (USL – Process Mean) and (Process Mean – LSL). In a way, this is an indirect method of assessing if the process centered to the tolerance.
As an analogy, in order to know if the plane is landing exactly on the middle of the landing strip, we look at the distance of the plane’s nose from either edge of the strip. That is good but it’s only an indirect way of assessing the process center.
Now it’s look at Cpm and then draw comparisons.

Cpm
If you look at the formula of Cpm, it contains the target value. Thus in addition to obtaining the USL and LSL from the customers, we also obtain the Target value.
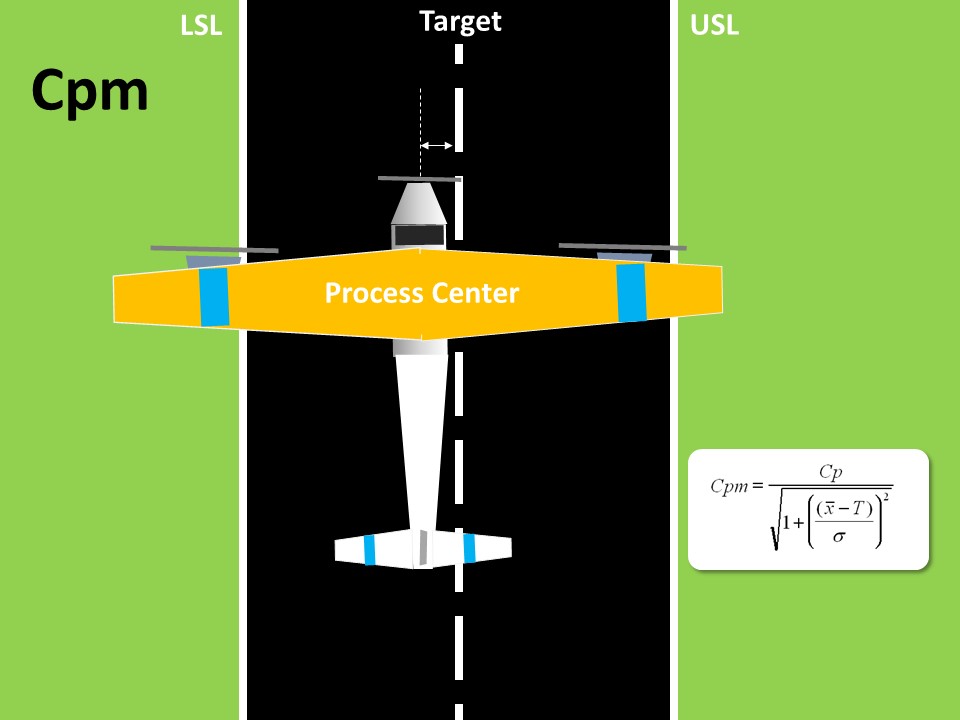
This means, Cpm is a true process centering capability index, because it compares the difference between process mean and target value. To draw an analogy to plane landing, we are comparing the plane nose to the median line of the strip.
Let’s now take a few scenarios to compare Cpk and Cpm values.
Cpk and Cpm Scenario 1
Process is centered, mean and target are close to each other. Cpk and Cpm are high and nearly the same.

Cpk and Cpm Scenario 2
Process is not centered and Cpk & Cpm both have reduced.

Cpk and Cpm Scenario 3
Process is centered but tolerance is liberal. Thus Cpk and Cpm values are very high.

ScCpk and Cpm Scenario 4
Out here, the process has liberal tolerance but a meagre shift from the target. In this scenario Cpk value hasn’t really dropped much, but Cpm has crashed down. While this example is an extreme scenario with very liberal tolerance, it’s meant to illustrate the fact that Cpm is very sensitive to even small shift in mean from center, while Cpk isn’t.

Cpk and Cpm Scenario 5
In this case, there is only a specification on one side. In most business processes, Service Levels have only an upper or lower specification. In some cases, Cpk looses its significance. However, in all service scenarios, there is a target value. For ex: customers are told that payment will be updated in 4 hours but the internal target is to get it done in 2 hours. Process is capacitized for 2 hours. In also such scenarios Cpm will be a relevant centering metric.

In this scenario, Cpk is high but Cpm isn’t. This Cpm is a good capability measure for one sided tolerances.
Cpk and Cpm Scenario 6
This is a unique case, where the Target isn’t the center of tolerance. This situation can occur in process industries and for certain critical dimensions where we intentionally set the process not at the center but to one side (such as to offset for tool wear in grinding).

From the above 6 scenarios, it is clear the Cpm is a robust process centering capability index which can be used to evaluate process shifts, drifts, one-sided specifications and non-centered specifications.
To further get some hands-on practice, try drawing the following values in paper and then calculated CpK and Cpm.
usl = 30, lsl = 6, Target = 18, Mean = 10, SD = 0.6
Tags
Whatever is the nature of your business, innovation is critical today. In order to survive competition and be the customers’ choice, you need to come up with really new products and services. All it means is that your ability to manage the change is a direct measure of your success. In other words, timely launch of new products/services in desired quality and price are going to determine your success, apart from cultural change aspect. So whether you want it or not, good project management skills are essential in today’s business to survive and win. Without digressing on other pre-requisites of good project management, let’s focus on one of most important but rarely focused area.
There are several project management techniques and tools available such CPM, PERT and Critical Chain. Immaterial of the base on which these models are structured, out of my experience, everything finally boils to predicting time duration for a task and the delivering as predicted. In small organizations(less than 10 employees), it is more of coordination, multi-tasking and communication that will determine if a task can be completed as predicted. But with organizations involving a few tens of employees, it is all about how resources and efforts are synchronized. There may be lack of knowledge of what is to be done next, on who owns which piece, how & when to escalate lack of clarity on authority and decision making. Additionally unlike bigger organizations, smaller companies will have to manage with inexperienced and understaffed scenarios.
So to make life easy for everyone, if processes associated with project management such as supply chain management processes, finance processes, clearly defined inter-department service levels and authorities, etc., are established well, that will help the organization deliver projects in time. Isn’t this what ‘Process Management’ is all about! Mathematically also it makes sense to focus on process management. For instance, consider the PERT model in which the PERT Time (Task duration) is a function of Optimistic Time (OT), Most Likely Time (MLT) and Pessimistic Time (PT). When OT and PT are wide apart, it means that it is not possible to predict the task duration accurately. In other words, the process on which the task is dependent has high variation. Such a process leads to higher PERT Time. When all the tasks of the project have widely spread OTs and PTs, the overall project duration itself will be high and unpredictable.
In order to have closely defined OTs and PTs, we should have confidence that our processes will consistently deliver on-time. In other words, our process should be statistically under control and stable. Again, it’s Process Management!