What do you understand by Theory of Constraints (ToC)?
The Theory of Constraints (TOC) is a management approach to managing the weakest link in a process. A process can have one or more weak links, called constraints, that can be anything that prevents the process from performing to its maximum potential. TOC contends that a few constraints control the performance of a process, and therefore provide a mixture of related processes and interrelated concepts to increase the throughput.
What do you mean by throughput and Drum-Buffer-Rope in TOC?
Throughput – Throughput is the rate at which a process generates money through sales, not through production.
Drum-Buffer-Rope – Drum-buffer-rope is a TOC production planning technique that maximizes the flow of materials in a plant for which there is an immediate customer demand.

What the 5 steps followed in theory of constraints approach?
Theory of constraints has five steps. They are;
- Identify the constraint : The constraint must be identified before an attempt is made to improve the throughput.
- Exploit the constraint : If a constraint is responsible for reducing the output, then it should be pushed to yield the maximum output.
- Subordinate to the constraint : The rest of the process should provide maximum support to the constraint to maximize its throughput.
- Elevate the constraint : Improve performance by adding more capacity by way of additional resources.
- Do not let inertia set in : If the weak link has been strengthened, go back to step one and implement TOC on the new weakest link.
Tags
Cpm is yet another interesting process capability metric that is not very popular. In fact it is more robust than Cpk.
Cpm is an advanced measure and it corrects some deficiencies in Cpk. It is also called as Taguchi Capability Measure. In order for us to understand Cpm, let’s take a step back and understand Cpk.
Cpk
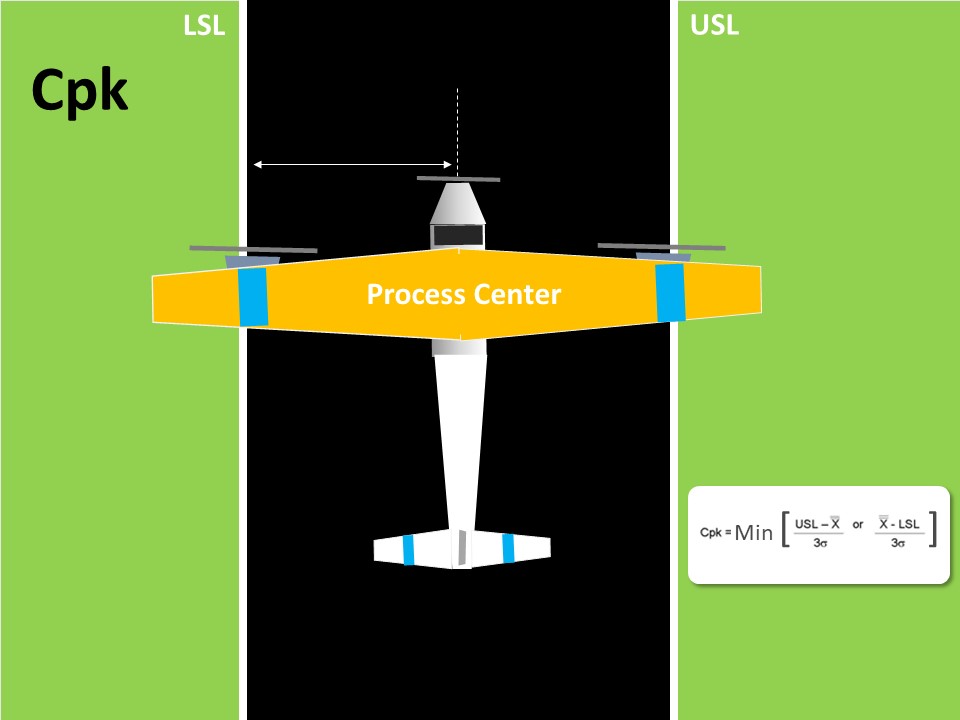
Cpk is considered as a measure of the process centering. If you closely observe the Cpk formula, it doesn’t take the actual Target value. Target Value is the center value obtained from customer specification.
However it takes the lowest value of (USL – Process Mean) and (Process Mean – LSL). In a way, this is an indirect method of assessing if the process centered to the tolerance.
As an analogy, in order to know if the plane is landing exactly on the middle of the landing strip, we look at the distance of the plane’s nose from either edge of the strip. That is good but it’s only an indirect way of assessing the process center.
Now it’s look at Cpm and then draw comparisons.

Cpm
If you look at the formula of Cpm, it contains the target value. Thus in addition to obtaining the USL and LSL from the customers, we also obtain the Target value.
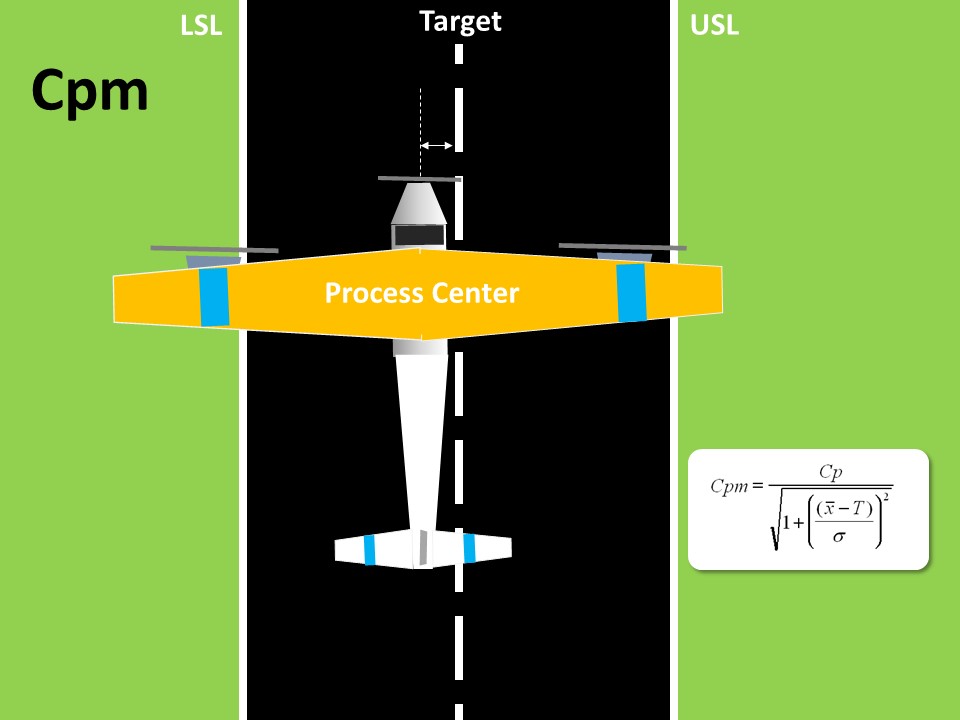
This means, Cpm is a true process centering capability index, because it compares the difference between process mean and target value. To draw an analogy to plane landing, we are comparing the plane nose to the median line of the strip.
Let’s now take a few scenarios to compare Cpk and Cpm values.
Cpk and Cpm Scenario 1
Process is centered, mean and target are close to each other. Cpk and Cpm are high and nearly the same.

Cpk and Cpm Scenario 2
Process is not centered and Cpk & Cpm both have reduced.

Cpk and Cpm Scenario 3
Process is centered but tolerance is liberal. Thus Cpk and Cpm values are very high.

ScCpk and Cpm Scenario 4
Out here, the process has liberal tolerance but a meagre shift from the target. In this scenario Cpk value hasn’t really dropped much, but Cpm has crashed down. While this example is an extreme scenario with very liberal tolerance, it’s meant to illustrate the fact that Cpm is very sensitive to even small shift in mean from center, while Cpk isn’t.

Cpk and Cpm Scenario 5
In this case, there is only a specification on one side. In most business processes, Service Levels have only an upper or lower specification. In some cases, Cpk looses its significance. However, in all service scenarios, there is a target value. For ex: customers are told that payment will be updated in 4 hours but the internal target is to get it done in 2 hours. Process is capacitized for 2 hours. In also such scenarios Cpm will be a relevant centering metric.

In this scenario, Cpk is high but Cpm isn’t. This Cpm is a good capability measure for one sided tolerances.
Cpk and Cpm Scenario 6
This is a unique case, where the Target isn’t the center of tolerance. This situation can occur in process industries and for certain critical dimensions where we intentionally set the process not at the center but to one side (such as to offset for tool wear in grinding).

From the above 6 scenarios, it is clear the Cpm is a robust process centering capability index which can be used to evaluate process shifts, drifts, one-sided specifications and non-centered specifications.
To further get some hands-on practice, try drawing the following values in paper and then calculated CpK and Cpm.
usl = 30, lsl = 6, Target = 18, Mean = 10, SD = 0.6
Tags
Measure Phase of Lean Six Sigma Project is the second phase. Following are the deliverable of this phase:
- Identify all possible causes (Cause & Effect Diagram)
- Validate Measurement System, Data Collection & Sampling
- Establish Process Capability
Identify all possible Causes (Cause & Effect)
In the measure phase of a Lean Six Sigma Project, the team brainstorms to identify all possible causes or reasons for the occurrence of the problem. Thus, there is a direct linkage between a project charter and this deliverable. Fish-bone diagram is a structured brainstorming method used to carry out this activity. Fish-bone diagram is also called as Ishikawa or Cause & Effect diagram. After completing this brainstorming, the team applies the 5-why technique to further explore the underlying causes for all the reasons identified in the fish-bone diagram. At the end of these two activities, the team has an exhaustive list of possible causes for the problem. Usually there are around 50~100 possible causes for the problem. It is the responsibility of Six Sigma Green Belt to facilitate these activities.
As a next step, using their process knowledge and experience, the team has to agree on few causes; which potentially cause the problem. There are several methods to do this, but the most popular method is the use of Cause & Effect Matrix (C-E Matrix). Potential Causes are suspects that are causing the problem. However, before acting on them, the team needs to gather data or facts to validate them.
Validate Measurement System, Data Collection & Sampling
Data Collection plays a very important role in all Six Sigma projects. But before collecting data, the team has to assess if the measurement system (measuring instrument, appraiser & environment in which measurement happens) is accurate and precise. Hence the team has to perform Measurement System Analysis (MSA) – aka Gage R&R. Once the team ascertains that the measurement is good, then a data collection plan is prepared. Data Collection Plan (DCP) includes the measures whose data needs to be collected, how much data to collect, data source, and who will collect the data, etc. While the entire team can participate in this activity, Six Sigma Green Belt has to take a lead role, as this will involve technical concepts of Gage R&R covered in the training program.
Unlike conventional data collection; in Lean Six Sigma projects, data is collected on both the CTQ and the potential causes identified in a Cause & Effect Matrix. Due to the quantum of data involved in most businesses, it isn’t practically viable to collect data of the entire population. Hence the team has to resort to statistical sampling methods.
As a next step, data collection is executed. From time-to-time a Six Sigma project team needs to validate the data collected. Sometimes, the data collectors need to be trained and retrained. Once the data collection is complete, it is ready for a process capability assessment. Usually many projects get delayed because of poor data quality or delay in collecting sufficient data. When a Six Sigma Green Belt takes special care, this activity can get completed on time.
Establish Process Capability
Process Capability is the ability of the process to deliver as per customer requirement. There are various process capability indices, but in Lean Six Sigma projects, sigma capability is the most popular measure. This exercise gives an accurate report on the current process performance. As these indices are covered in the training program, Six Sigma Green Belt has to take a lead role in conducting this study. The output of Process Capability study can be used to validate the process objectives and anticipated benefits in the charter. If needed, the Lean Six Sigma project charter can be revisited.
On completion of the above deliverable, and a formal Measure Phase tollgate review, the team is ready to move into Analyze phase. Next>>>
Tags
Related Articles
Measure Phase of Lean Six Sigma Project is the second phase. Following are the deliverable of this phase:
- Identify all possible causes (Cause & Effect Diagram)
- Validate Measurement System, Data Collection & Sampling
- Establish Process Capability
Identify all possible Causes (Cause & Effect)
In the measure phase of a Lean Six Sigma Project, the team brainstorms to identify all possible causes or reasons for the occurrence of the problem. Thus, there is a direct linkage between a project charter and this deliverable. Fish-bone diagram is a structured brainstorming method used to carry out this activity. Fish-bone diagram is also called as Ishikawa or Cause & Effect diagram. After completing this brainstorming, the team applies the 5-why technique to further explore the underlying causes for all the reasons identified in the fish-bone diagram. At the end of these two activities, the team has an exhaustive list of possible causes for the problem. Usually there are around 50~100 possible causes for the problem. It is the responsibility of Six Sigma Green Belt to facilitate these activities.
As a next step, using their process knowledge and experience, the team has to agree on few causes; which potentially cause the problem. There are several methods to do this, but the most popular method is the use of Cause & Effect Matrix (C-E Matrix). Potential Causes are suspects that are causing the problem. However, before acting on them, the team needs to gather data or facts to validate them.
Validate Measurement System, Data Collection & Sampling
Data Collection plays a very important role in all Six Sigma projects. But before collecting data, the team has to assess if the measurement system (measuring instrument, appraiser & environment in which measurement happens) is accurate and precise. Hence the team has to perform Measurement System Analysis (MSA) – aka Gage R&R. Once the team ascertains that the measurement is good, then a data collection plan is prepared. Data Collection Plan (DCP) includes the measures whose data needs to be collected, how much data to collect, data source, and who will collect the data, etc. While the entire team can participate in this activity, Six Sigma Green Belt has to take a lead role, as this will involve technical concepts of Gage R&R covered in the training program.
Unlike conventional data collection; in Lean Six Sigma projects, data is collected on both the CTQ and the potential causes identified in a Cause & Effect Matrix. Due to the quantum of data involved in most businesses, it isn’t practically viable to collect data of the entire population. Hence the team has to resort to statistical sampling methods.
As a next step, data collection is executed. From time-to-time a Six Sigma project team needs to validate the data collected. Sometimes, the data collectors need to be trained and retrained. Once the data collection is complete, it is ready for a process capability assessment. Usually many projects get delayed because of poor data quality or delay in collecting sufficient data. When a Six Sigma Green Belt takes special care, this activity can get completed on time.
Establish Process Capability
Process Capability is the ability of the process to deliver as per customer requirement. There are various process capability indices, but in Lean Six Sigma projects, sigma capability is the most popular measure. This exercise gives an accurate report on the current process performance. As these indices are covered in the training program, Six Sigma Green Belt has to take a lead role in conducting this study. The output of Process Capability study can be used to validate the process objectives and anticipated benefits in the charter. If needed, the Lean Six Sigma project charter can be revisited.
On completion of the above deliverable, and a formal Measure Phase tollgate review, the team is ready to move into Analyze phase. Next>>>