Tags
In the previous topic, you created a tree diagram. Key issues identified must also be sorted in the order of their importance. A prioritization matrix helps determine the order for dealing with different issues or selecting solutions according to their relative importance. In this topic, you will create a prioritization matrix to identify crucial issues that require immediate attention.
You must prioritize key issues identified according to their importance to determine which issues or solutions are the most critical and need to be addressed first. Using a prioritization matrix, you can determine such crucial areas where Six Sigma projects need be implemented to improve your business processes.
What are Prioritization Matrices?
A prioritization matrix is a tool used for determining the most important issues or solutions. This tool can be used for any prioritization activity. In a Six Sigma project, it can be used for filtering or prioritizing either causes or solutions. For example, the cause-and-effect matrix is a prioritization matrix used for prioritizing causes, while the criteria-based matrix is used for prioritizing solutions.
Whatever the matrix, the procedure used for prioritization is the same. The Six Sigma team identifies different criteria to be used for measuring different solutions. The relative importance of each criterion is determined and a numerical value indicating the weight of each criterion is entered in a column. Ratings are then assigned to the solutions against different criteria. The different solutions are scored against the identified criteria. Each rating is then multiplied by the criteria weights to obtain the weighted scores. The weighted scores are then added to find the cumulative value. The option with the highest total value is regarded as the option with the highest priority.
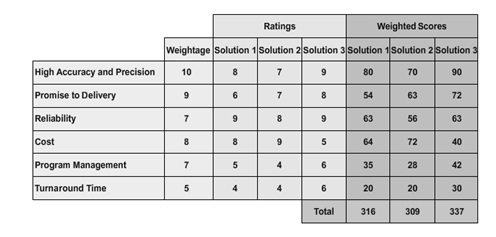
Fig: A sample prioritization matrix

What are the use of Prioritization Matrices?
- Prioritizing complex issues involving several criteria against which the issues are assessed.
- Assigning scores to the criteria or issues when data is available.
- Choosing key areas to be focused upon immediately.
- And, garnering team support and approval of crucial issues.
How to Create a Prioritization Matrix?
To create a prioritization matrix for determining key areas where Six Sigma projects need be implemented first:
- Gather the team members required to participate in the exercise.
- It is not necessary to limit the team to only the project team members.
- Involve all stakeholders who would have influence on the items to be prioritized.
- Ideally, the size of the team should be around eight.
- Agree upon the scope and the duration of the exercise because there is a tendency to drift from the main subject of interest, which may consume more time.
- Identify criteria against which the items to be prioritized can be weighed. Select the criteria according to your business and the nature of the process.
- Assign weights to the criteria on a scale of 1 to 10.
- Use an ascending scale while assigning the weight. Usually, the higher the better.
- Draw consensus within the team on the weights.
- Assign ratings for each item to be prioritized against different criteria on a scale of 1 to 10. Alternatively, the team can also pick solutions one by one and gather votes for each criterion. Members who agree that a solution fits a particular criterion vote for it. Ensure that necessary information is available to the team before voting.
- Compute the total score for each item.
- Multiply the rating for an item by the weight.
- Add the total scores for each item.
- Continue doing this for every criterion of all the items.
- Shortlist the items with higher scores for implementation.
Tags
The metrics of a Six Sigma project reflect customer needs and ensure that the internal metrics of the organization are achieved. The selection of project metrics is one of the crucial elements in the Define phase of the Six Sigma methodology.
Six Sigma project metrics can be categorized into primary metrics and secondary metrics.
Primary Metrics
A primary metric, also called a project CTQ, is a CTQ measure that is used to monitor project progression and success. It is the reference point throughout the Six Sigma project. Ideally, project CTQs should have direct impact on customers. For any Six Sigma project, the primary metrics should be:
- Tied to the problem statement and objective of the project.
- In possession of an operational definition.
- Measurable, simple, and expressed in the form of an equation.
- Aligned to business objectives.
- Tracked on hourly, daily, weekly, and monthly basis.
- Expressed graphically over time with a run chart, time series, or control chart.
- And, validated with a Measurement Systems Analysis (MSA).
Some of the primary metrics of a Six Sigma project include customer satisfaction, on-time delivery of products, final product quality, and less costly products.

Secondary Metrics
A secondary metric, also known as a consequential metric, is a project metric that you do not want to sacrifice at the expense of primary improvements in a process. These metrics ensure that the process is improving and not shifting one metric at the expense of another. It means that the secondary metrics have a relationship with the primary metrics of a Six Sigma project. Therefore, the primary goal of a Six Sigma project will be to move the primary metrics, but ensure that secondary metrics do not deteriorate or stay constant. Some of the secondary metrics include cycle time, volume shipped, inspection data, and rework hours. These metrics should not be sacrificed to achieve the primary metrics such as customer satisfaction, on-time delivery of products, and final product quality.
Tags
Quality Function Deployment (QFD) is a structured approach followed by customer-driven organizations to transform customer requirements into their product specifications.
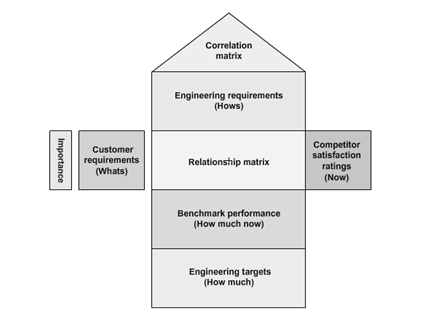
The House of Quality (HOQ) is a diagram used by a product development team during the initial stage of the QFD process.
It uses a planning matrix to define the relationship between customer requirements and the capability of the product and the company to satisfy these requirements. Because this matrix looks like a house, where customer requirements and product attributes resemble the main living quarters, competitive analysis resembles the porch, and the correlation matrix resembles the roof, it is called House of Quality.
HOQ encompasses different QFD elements used for understanding customer requirements and aligning business processes to meet these customer requirements.
It starts with customer requirements. The customers for a product or service are identified and their requirements from the product or service are gathered using different tools such as focus groups, surveys, and customer experiences. A structured list of customer requirements is then drawn by analyzing and organizing this data using tools such as affinity diagrams and tree diagrams.
Importance ratings are used for quantify the customer requirements and rated according to their importance on a scale of 1 to 5. This rating will be used in the relationship matrix at a later stage.
Another element is the Competitive analysis where customers views about the competition are gathered through research to provide a better understanding of the market. Here, the customers rate an organization’s products or services against competitors’ products or services. Also, Technical requirements that are not known to customers are identified and documented. These requirements generally stem from management or regulatory standards that a product must meet.

Relationship matrix defines the relationship between customer requirements and an organization’s ability to meet those requirements is determined. The relationship between the two factors is classified as weak, moderate, or strong and given the values of 1, 3, and 9, respectively. Even, in Importance weighting rating, Customer requirements are weighted according to their importance for defining and prioritizing key criteria. The relative importance of customer needs and the company’s and competitor’s performance are taken into account while calculating this. Target values for each product or service attributes, known as technical descriptors, that can be used as benchmarks against competitors’ target values are established. These target values are the “how much” of these product or service attributes.
The technical descriptors are compared with the competitors’ technical descriptors using scientific analytical techniques to assess their properties is called Engineering analysis. This also includes reverse engineering competitors’ products or services to determine the values for their technical descriptors. Correlation matrix is the relationship among customer requirements are analyzed to identify correlated requirements. The relationships are then ranked for determining areas of improvement that need to be focused upon.
Tags
Identify
The voice of the customer (VOC) is gathered and converted into technical requirements in this phase. A business case is then established and a project charter is prepared along with milestones. A team is also formed to carry out the project. Roles and responsibilities of the team members are also set during this phase. These activities are accomplished using tools such as Quality Function Deployment (QFD); Failure Modes and Effects Analysis (FMEA); the Suppliers, Inputs, Process, Outputs, and Customers (SIPOC) diagram; the Integrated Product Delivery System (IDPS); target costing; and benchmarking.
Design
In this phase, the concept design is developed by formulating alternative concepts and choosing the best concept after evaluating the alternatives. Risks associated with the chosen concept design are also determined. The functional requirements and their Critical to Quality (CTQ) attributes are identified by the Six Sigma team. The CTQ attributes are deployed after assessing their effect on functional requirements. Raw materials and their procurement plan with the related manufacturing plan are created during this phase. In addition, the Sigma capability is predicted. These activities are accomplished using tools such as smart simple design, risk assessment, FMEA, engineering analysis, materials selection software, simulation, DOE, systems engineering, and the capability of the process is evaluated to verify if the CTQs can be met.
Optimize
The design is optimized for reliability and performance by developing detailed design elements. This helps optimize the Sigma capability and cost. These activities are accomplished through manufacturing database and flowback tools, a design for manufacturability, process capability models, a robust design, Monte Carlo methods, tolerancing, and Six Sigma tools.
Validate
The prototype is tested using formal tools to validate the design. After evaluating the performance, failure modes, and risks of the design, new requirements to be met are sent to manufacturing and sourcing units. The design is iterated until it meets the requirements of the customer. A final phase review to assess the reliability is also carried out to validate the design. The term Verify is also used interchangeably for this phase. These activities are accomplished through accelerated testing, reliability engineering, FMEA, and disciplined New Product Introduction (NPI).
Tags
Organizations strive to eliminate three basic categories of waste in their business processes.
Basic Waste Category are:
- Wasteful activity – Work that adds no value to a product or service. Eliminating such activities from business processes will help organizations cut cost.
- Unevenness – This denotes inconsistencies that exist in a business process. Unevenness and inconsistencies can be avoided by eliminating inventory and supplying items to the production process only when they are needed.
- Overburden – This is caused by an unreasonable or excessive strain on resources. It can be eliminated by simplifying and standardizing processes.
Among these three basic categories of wastes, Lean focuses on eliminating activities that do not add any value. These activities are further classified into seven types of wastes: transport, inventory, motion, waiting, overproduction, over processing, and defects.
Tags
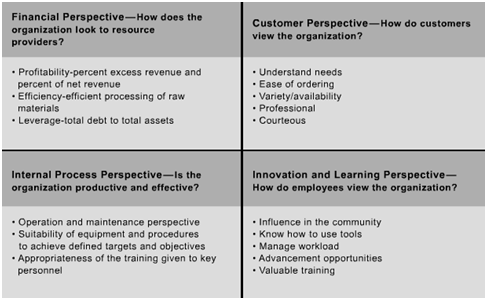
A Balanced Scorecard (BSC) is a strategic performance management framework for measuring the impact of strategic decisions across all organizational drivers of an organization. A BSC provides a wider perspective on strategic decisions made by an organization by measuring the impact on key business drivers such as finance, customer requirements, internal processes, innovation, and growth perspectives.
The BSC was conceived with the intent to overcome the limitations of traditional performance measurement tools. At the basic level, managers utilize it to track the activities of their direct reports and monitor the impact of their actions. At the decision-making level, a BSC is used both as a tool that facilitates strategic decision-making and as one that provides an insight into future performances.
Example of Balanced Scorecard?
An automobile manufacturer embraced BSC as a way to remain competitive in a rapidly evolving sector. The ensuing benchmarks show how BSC permeated into each department to coordinate the delivery of quality products and the ability to offer diverse models.
Tags
Six Sigma is a customer-focused approach to business process improvement and performance management which encompasses a statistical and method-driven process. In order to effectively deploy the process in your organization, it is necessary to identify the basic elements that drive the Six Sigma methodology. Knowledge of the Six Sigma fundamentals is the first step toward a successful Six Sigma implementation. Before applying any business strategy in an organization, you must identify the goals and benefits of the strategy. You must also recognize the need for such a business strategy in the organization.
Surviving in a business world that is full of competition is crucial to any organization. Six Sigma provides the means to handle declining product prices in the market, which helps any organization compete with the best companies in business. It targets zero defects by setting a common performance goal for the entire organization. Six Sigma helps an organization achieve increased profitability and quality improvement rates, ahead of any of its competitors. Reduced scrap-related costs, rework, improved yield, and increased customer satisfaction are identified in companies striving to achieve Six Sigma.
A Six Sigma initiative differs from other quality improvement methodologies because it ensures that the costs involved in implementation are offset by the gains received from improvements.
The primary goal of Six Sigma is to implement a measurement-based strategy in an organization that concentrates on process improvement and reducing variation. In addition to this, the other important goals of Six Sigma include:
- Reducing the number of defects, leading to the improved quality of a product or service.
- Achieving customer satisfaction by ensuring that customer expectations are met.
- Reducing cycle time, which enables the faster delivery of products.
- And, higher profitability by improving efficiency and effectiveness of the organization.
Tags
Whatever is the nature of your business, innovation is critical today. In order to survive competition and be the customers’ choice, you need to come up with really new products and services. All it means is that your ability to manage the change is a direct measure of your success. In other words, timely launch of new products/services in desired quality and price are going to determine your success, apart from cultural change aspect. So whether you want it or not, good project management skills are essential in today’s business to survive and win. Without digressing on other pre-requisites of good project management, let’s focus on one of most important but rarely focused area.
There are several project management techniques and tools available such CPM, PERT and Critical Chain. Immaterial of the base on which these models are structured, out of my experience, everything finally boils to predicting time duration for a task and the delivering as predicted. In small organizations(less than 10 employees), it is more of coordination, multi-tasking and communication that will determine if a task can be completed as predicted. But with organizations involving a few tens of employees, it is all about how resources and efforts are synchronized. There may be lack of knowledge of what is to be done next, on who owns which piece, how & when to escalate lack of clarity on authority and decision making. Additionally unlike bigger organizations, smaller companies will have to manage with inexperienced and understaffed scenarios.
So to make life easy for everyone, if processes associated with project management such as supply chain management processes, finance processes, clearly defined inter-department service levels and authorities, etc., are established well, that will help the organization deliver projects in time. Isn’t this what ‘Process Management’ is all about! Mathematically also it makes sense to focus on process management. For instance, consider the PERT model in which the PERT Time (Task duration) is a function of Optimistic Time (OT), Most Likely Time (MLT) and Pessimistic Time (PT). When OT and PT are wide apart, it means that it is not possible to predict the task duration accurately. In other words, the process on which the task is dependent has high variation. Such a process leads to higher PERT Time. When all the tasks of the project have widely spread OTs and PTs, the overall project duration itself will be high and unpredictable.
In order to have closely defined OTs and PTs, we should have confidence that our processes will consistently deliver on-time. In other words, our process should be statistically under control and stable. Again, it’s Process Management!
Tags
In a Continuous improvement journey, improvement projects are nothing but the lifeline. In this series of articles, we covered on the Need for Project Selection and the Criteria for project. Now we’ll answer the big question – Where can I get my projects from? Essentially various sources of the project!
- Customers Interactions: “Customers” are the biggest source for improvement projects. Classically, negative customer sentiments are good places to start. Your customers are unhappy, so it’s time to fix the issue. Mixed or ambiguous sentiments are also relevant places to start.
- Customer Complaints:If your organization has a list of customer complaints, then that is an apt place to commence. Complaints are not only sore for your customers, but for you too. Such complaints may cover a vast product or service attributes such as product or service quality, delivery time, responsiveness, people issues, pricing or areas of monetary impact including warranty claims,process & policy issues.
- Repeat Complaints: You can go one step further and target repeat complaints instead. Repetitive complaints from the same customer with the same tagging indicates high priority area for improvement.
- Enquiries & Requests: Few organizations target the need of customers to call or contact the organization and, reduce them. It might not be a complaint, instead just an enquiry or request. In other words, interactions with the organization that can be avoided. Looking at enquiries and requests serve as a proactive means to identify future problem areas.

- VoC Program output: If your organization conducts structured VoC surveys, then the outputs of such mechanism can be a good source of Continuous Improvement or Lean Six Sigma projects
- Customer Experience (CX) Dipstick: Customer Experience is usually hidden and not so obvious as customer feedback. Structured and unstructured mechanisms can be deployed to understand the customer experience. For example, many organizations now use mystery shopping to unearth issues in customer experience. Observation or Listening posts are also a good way to identify how customer experience can be improved.
- First Time Right (FTR): If you closely have a look at your company’s process, you will find that there are many internal defects (work-in-progress) occurring, such as rework, repairs & in-process rejections. Such defects are silent killers because they drain organization’s efficiency and effectiveness silently. If your organization is measuring FTR, then its improvement can be an ideal project. More evolved organizations use RTY (Rolled Throughput Yield) as a metric which is also a good place to demonstrate Continuous Improvement.
However, most organizations have a simpler measure of success for quality – Defect Rate (% Defective). While there’s nothing wrong with this metric, is a bit holistic and hence factors leading to inefficiencies escape unnoticed with this metric. Nonetheless, it is good starting point for Continuous Improvement projects. - Reliability Data/Warranty data: Field failures are sometimes grave. It can cost you a lot and, the overall cost of ownership for customers might increase esp if the warranty is denied or the product is under breakdown. In broader terms, the principle of warranty is to institute accountability in the event of an untimely failure of an item or the inability of the item to perform its intended function. Experts consider reliability data analysis as a quality measure over time. This reliability analysis is done to analyze whether your product will survive for the time defined by the company in the normal conditions. Improving the reliability of a product can work both ways – organizations can lower its operational cost and provide longer warranty and customers would experience break down less often.
- Process Performance Data: If your organization has a well-defined and structured reporting mechanism for process performance metrics, such as a dashboard or scorecard, then it would be a very good source to identify opportunities for continuous improvement projects. As leadership teams are consumers of such reports, such opportunities can easily gain sponsorship as well.
- Competitive Benchmarking: Benchmarking is a continuous process of comparing your firm’s or company’s practice to those of the competitors or say most successful competitors. In certain cases, you might not be doing well. For example, having control over the delivery time to the customers. Then this can be taken as a project for improvement in our company. So, to generalize, competitive benchmarking results can also be a good source for Continuous Improvement projects.
- Business Plans/Strategies: Gap between strategic plan and reality can be the cause of concern for leadership. Sometimes such problems may be because of supporting processes. They can hinder new business plans or strategies. Such process improvement opportunities are also a good source for projects, provided they are scoped well with well-defined objectives & goals.
- Employee Feedback: While customers don’t see your process but only experience its outcomes, employees have an end to end visibility. They experience problems as customers and can associate inward aspects of such poor experience. Many organizations, pilot their products with employees, because employees are pseudo customers. If you can establish a structured process through which employees are encouraged to share their experience and enable them to take up such opportunities as Continuous Improvement or Lean Six Sigma projects, there’s nothing like it.
All the above can serve as a good source for Continuous Improvement or Lean Six Sigma projects.
Tags
We talked about the need for Lean Six Sigma project selection in detail in the earlier articles, in this one we’ll cover the criteria for selection and the in the following article, we’ll move on to talk about the tools used for selection and how to engage the stakeholders in the process.
I have found that while leaders agree on the need for project selection, their views on the criteria is quite divergent. Most of them see this as a process to sway the process in favor of their priorities and interests.
There is nothing wrong in doing so, as long as the process is not biased.
Through this article, we draw consensus on the criteria and its relevance to the whole process.
The real good news is that the criteria for getting the project selection right are not too complicated.
What does project selection countdown look it? We’re going to start with the least of the top 5 criteria and find our way to the top most criteria.
Here you go:
7. Probability of Success:
Not all the projects will be successful in any company. Hence, while selecting the project, most project leaders consider the contingencies which might come up and use that as a yardstick to select the project. Sponsors want their project leaders to be successful equally as projects leaders’ desire success. Well, sounds like a good approach. But doesn’t this approach make it very orthodox? Unlike other implementation projects in technology, improvement projects are bound to have ups and downs; and it is quite natural that not all projects achieve their goals. That is what continuous improvement is all about.
Thus choosing to play it safe isn’t the best criteria to select projects, though unfortunately, it is very popular criteria in use. That is why Probability of Success is the last in our countdown list! One of the organizations flips these criteria to select the project which has failed in the past or have a low probability of success as Black Belt project. That is certainly a best practice to emulate.
6. Availability of Data:
Is data readily available for the project? If not, can it be easily gathered? While most project leaders and sponsors know that rarely will all the data needed for a project is waiting around to be analyzed. But they use the availability of data criteria to select projects because the unreasonable expenditure of time, resources and effort can be avoided. Yes, data is needed for analysis. But making it a criterion reduces the scope Continuous Improvement deployment.
Improvement projects are expected to venture into unchartered territories of the process and present root cause and opportunities. Getting people to measure something that is not being reported till now, in it is a feat. Having vanilla project can hardly be a criterion for project selection. That is why the availability of data comes second last in our countdown!

5. Savings potential:
Any project implemented, is implemented with an intention to gain any kind of tangible or say monetary benefits. But along with monetary benefits, there are other benefits like customer satisfaction, increased efficiency, total company involvement; increases workspace and much more. While it is absolutely apt to select projects which have savings to the organization, it is misleading to make saving potential a primal purpose of projects. I have seen many times, project leaders come up with simple ideas or improvements with a huge saving potential to the organization, but virtually no complexity involved. Such projects hardly qualify for Black Belt projects.
They best serve as Just Do It project. Giving undue importance to saving potential in project selection also sends the wrong message across the organization. That is why I not really excited about having this as a top item in the countdown. That’s why Saving Potential is only Number 5 in our countdown.
4. Apt Time:
There is always a perfect timing to initiate a project. Relevance is contextual. By apt timing, I mean both the time to commence, and the closure as per plan. An important project has to close on time. It has to be first of all, planned to close on time. It has to be scoped to close on time. That is why Apt Time is No.4 in our countdown.
3. Availability of Resources:
I don’t know if this has to do with the culture. Most organizations, if not all, end up with a laundry list of projects because everything seems to be Business or Customer priority. Even the biggest and richest of the organizations have limited resources. Either resource is depleted, busy elsewhere or simply not committed to deliver. The best person is often leading many projects, making everything he/she does venerable to failure. Project selection is about de-selection and not selected. Ruthlessly put ideas into a parking list for which right resources are not available; and if it is so important that it has to be executed now, then pull the right resource into this project rather than sharing.
While I have largely kept this point around manpower, it equally applies to money & time. I say with conviction that organizations that ensure that the leader of the Lean Six Sigma project is a dedicated resource, either full time or handling only one project even if it means he is part time on it are surely successful. This is why Availability of Resource is No.3 on our countdown!
2.Customer impact:
Ask yourself “will the results of the project bring any difference in the life of the customer? Will it improve the perception of the customers about the quality of your product or services?” Quite often this answer to this question is yes. Unfortunately, it’s motherhood in apple pie question. So insist on quantifying the impact.
If you can pin a number to the impact, then go ahead. And if you’re not able to do so, then there’s no point in wasting your time on the project. Consider Voice of the Customer in your organization as a starting point. Why don’t you start with complaints and alleviate customer pain? Thus Customer Impact is Number 2 in the countdown.
1.Business Priority:
Selection of projects is based on the need or priority of the business. Project leaders need to understand that the tail can’t wag the dog. Often, people package their ideas into a project and fuel it as an organizational priority. Scanning of the external and internal environment will give first-hand insight on what is the organizational priority, NOW? Go for it. Well, that may put you out of your comfort zone, competency or expertise, but remember that’s what the organization needs.
Without a real need, do you think any leader would offer sponsorship to your project or will it at all help anyone – NO.? That is why Business Priority is Number 1 in our countdown.
Project Selection and implementation of Lean Six Sigma is easy and at the same time should be handled delicately by keeping all the above aspects in mind otherwise it might turn into a big disaster. An effective diagnostic study is required before selecting projects and with the undivided involvement of the top management are pre-requisites for project selection.
Tags
As a business analyst you are often expected to act as a bridge between a functional domain and the business stakeholders. Business analysts must be great verbal and written communicators, tactful diplomats, problem solvers, thinkers and analyzers. Though you have been extensive training in project management and related areas, using systematic business and management tools such as graphical analysis, data distribution & visualization, statistical discovery, etc are considered to be difficult by many Business Analysts.
Fortunately Lean Six Sigma, which is process improvement methodology provides many of the tools that can be handy for Business Analysts at one place. It comprises of statistical tools and techniques along with visualization tools. There are many tools such as Visual Analysis & Data Discovery tools like Fish-bone, 5 why, in scope-Out scope, Box plots and analytical tools like MSA, Descriptive Statistics, Variation, Correlation and Regression. They are explained in brief as under:
Visual Tools:
There are many tools which a business analyst will learn from Lean Six Sigma Green Belt Certification. We’ll talk about few Visual analysis tools from Lean Six Sigma in brief as under:
- Fish Bone Diagram also called as Cause and Effect Diagram helps to reach the root cause of any business issue. The important characteristic of this tool is to categorize the issue into 6 different aspects like Men, Machine, Material, Measurement, Method and Mother Nature (Environment). This will help the analyst prioritize the problem and solve the problem in a systematic manner.
- Another tool for root cause analysis is 5-Why which involves repeating the question “Why” where each question forms the base of the next question and this will go on until the root cause is found. All the questions and answers of the 5 Why, are placed on a sheet of paper with the help of which the analyst can view the whole picture in a single page.
- Box plot is a quick way of visualization of data and is represented in the form of box & whiskers. It helps in scrutinizing and comparing sets of data which demonstrates the variation in the sample data set.
- Statistical process control (SPC) is method of measuring and controlling KPIs of any process. AKA control charts, this helps to proactively identify issues from data. It is a great tool for continuous monitoring of process parameters both in service and manufacturing processes.
- Run charts are similar to control charts and suggest shifts in the process over a period of time and points out special factors which influence the process variability.
- FMEA stands for Failure Modes and Effect Analysis which is an approach to identify all possible failures in any process. Like doing analysis of how and where we can fail so as to take precaution before even starting the implementation of any project. This is a very important element for the success of any project which will help a business analyst in his/her daily management.
Analytical Tools:
Here are few examples of data discovery analytical tools that a Business Analyst will learn from Six Sigma.
- Quite often Business Analysts struggle with poor data quality. MSA aka Measurement System Analysis is a Lean Six Sigma tool used to evaluate that whether the data collection method, the instruments/source used for measuring and whole measurement is precise & accurate or not. This is also used to ensure the integrity of data used for analysis and gauge the effects of errors in measurement used to make decisions taken for product or processes.
- Descriptive statistics includes the assessment of central tendency and measures of dispersion in the any data set. Further it helps to identify skewness, kurtosis, outliers, and specific patterns in the distribution.
- Analysis of Variance abstracted as ANOVA is a statistical hypothesis test used to identify significant factors that cause a particular business issue. The biggest the merit of such advanced statistical methods is in confidence & credibility that a Business Analyst can provide to the leadership and management on his analysis and conclusions.
- Correlation & Regression are similar tools used to establish a relationship between the two business variables such as revenue and capacity. By validating such relationships, the Business Analyst can bring out significant insights to the management.
A business analyst having Green Belt Certification shall have a comprehensive understanding of Lean six sigma and shall be able to apply its tenets to their daily work. The principles of Six Sigma are so widely applicable that employees getting trained are highly valued and aggressively sought after. Lean Six Sigma Certification will be a stepping stone for professionals to a higher level as you avail expertise in different problem solving tools and techniques of Lean Six Sigma.
Tags
Six Sigma has been a successful management approach, and a philosophy for many leading global enterprises. Let’s understand Six Sigma Process – in other words – Six Sigma Deployment Approach.
While the deployment of Six Sigma depends on several factors; the following approach explains Six Sigma process in its simplest form.
Six Sigma as a management discipline puts customer’s interest ahead of others. The process of gathering customer requirements is called as Voice of Customer (VOC). A good deployment program starts with VOC. Customer requirements directly translate into business performance standards. In Six Sigma and many quality management approaches, these performance standards are called as Customer Specification Limits.
Operational metrics and performance measures like KPIs are created based on customer requirements. Such operational measures or KPIs are called as Critical To Quality (CTQ) metrics in Six Sigma.
Output of existing processes is measured against customer requirements. This becomes a benchmark of performance. In Six Sigma, this step is called as Assessment of Current Process Capability.
In case an end-to-end process is not capable of consistently meeting customer requirements, and produces high volume of defects; it is taken up for improvement.
Process improvement approach used in Six Sigma is called as DMAIC. It is the acronym of Define, Measure, Analyze, Improve and Control: a 5 step improvement approach.
In this manner, Six Sigma aims to link Customers, Business Processes, CTQs and process improvement all together.
The real power of a Six Sigma Process is in consistently and iteratively following the above activities.
Thus, an organization following a Six Sigma Process:
- Systematically and regularly gathers VOC
- Measures its process capability
- Identifies improvement opportunities
- Uses DMAIC to improve its processes
Tags
While the deployment of Six Sigma depends on several factors; the following approach explains Six Sigma process in its simplest form.
Six Sigma as a management discipline puts customer’s interest ahead of others. The process of gathering customer requirements is called as Voice of Customer (VOC). A good deployment program starts with VOC. Customer requirements directly translate into business performance standards. In Six Sigma and many quality management approaches, these performance standards are called as Customer Specification Limits.
Operational metrics and performance measures like KPIs are created based on customer requirements. Such operational measures or KPIs are called as Critical To Quality (CTQ) metrics in Six Sigma.
Output of existing processes is measured against customer requirements. This becomes a benchmark of performance. In Six Sigma, this step is called as Assessment of Current Process Capability.
In case an end-to-end process is not capable of consistently meeting customer requirements, and produces high volume of defects; it is taken up for improvement.
Process improvement approach used in Six Sigma is called as DMAIC. It is the acronym of Define, Measure, Analyze, Improve and Control: a 5 step improvement approach.
In this manner, Six Sigma aims to link Customers, Business Processes, CTQs and process improvement all together.
The real power of a Six Sigma Process is in consistently and iteratively following the above activities.
Thus, an organization following a Six Sigma Process:
- Systematically and regularly gathers VOC
- Measures its process capability
- Identifies improvement opportunities
- Uses DMAIC to improve its processes
Six Sigma has evolved as a management discipline for improving processes, and providing customer delight. Some organizations like GE had adopted Six Sigma as their management philosophy.
So, Why Six Sigma? Why not follow other approaches like TQM, SCM, COPC, ISO, etc.
Let’s understand why many organizations choose Six Sigma over other approaches; and how they benefited.
There are 3 key salient features of Six Sigma that are noteworthy:
- Customer Centricity
- Process Orientation
- Fact Based Decision Making
Customer Centricity
While the emphasis on building business processes to meet customer requirements was first proposed by Joseph Juran & Edward Deming (fathers of modern Quality movement); it was taken seriously only with the advent of Six Sigma. Gathering the Voice of Customer and translating these requirements into product features, aka Quality Function Deployment (QFD), were loosely used in TQM. Whereas, in Six Sigma Voice of Customers (VOC) is the starting point.
Operational measures and performance measures (KPIs) are built based on VOC. These measures are called as CTQ (Critical To Quality). Customers’ needs constantly change. Such changing needs mean that processes also need to adapt and evolve. Six Sigma enables achieving this adaptation. While creating a new product or service line; the entire system is built to meet customer requirements. Such an approach is called as Design for Six Sigma (DFSS).
Process Orientation
Six Sigma builds strong process orientation within the organization. In Six Sigma, virtually every department, activity, or task is perceived as a process in itself or process step. What does that mean? It means a lot!
Every process produces few outputs, and in turn; requires few inputs. Outputs are consumed by Customers (internal or external); and inputs are provided by Suppliers. Such visualization is called as SIPOC in Six Sigma. This helps organizations to move away from the mind-set of fixing people when things don’t work; to fixing processes. In order to improve the outputs of any process or department, its process steps and inputs needs to be improved, and sometimes suppliers need to be educated. People are never penalized in Six Sigma!
Traditionally many industries & functions are regarded as ‘people’ driven. For instance, industries such as Hospitality, Entertainment & most service lines and functions such as HR, Marketing, Sales, Admin. Six Sigma organizations treat these as just another process. As a result, the dependency on individuals is also reduced. Organizational silos are challenged and processes are simplified.
Driving strong process orientation across the organization has resulted in unbelievable tangible and intangible benefits to customers and organizations. GE is a pioneer in driving process orientation in its Financial Service businesses.
Fact Based Decision Making
Once organizations establish process orientation; access to data and factual information will increase. This presents the next big opportunity for organizations. Across levels, organizations are dependent on their managers to take right decisions. Most often, these decisions are punctuated by decision maker’s bias and personal intuition. Wrong decisions are costly and usually borne by the organization.
Six Sigma’s bouquet of tools enables data or fact based decision making. This means the overall management is much more efficient and accurate. DMAIC, an acronym for Define, Measure, Analyze, Improve and Control, is a method used for solving problems. There are over 50 qualitative and quantitative tools which are part of DMAIC. These tools can be applied in several stand-alone situations too. These tools enable data or fact based decision making.
At a personal level, an individual practicing Six Sigma over a period time is more efficient and effective than her peers. This has direct impact on career and growth prospects.
Thus Six Sigma is a powerful approach which is not only beneficial to organizations; but also to individuals.
If you are interested in Six Sigma Certification Courses, visit our products page. Click here