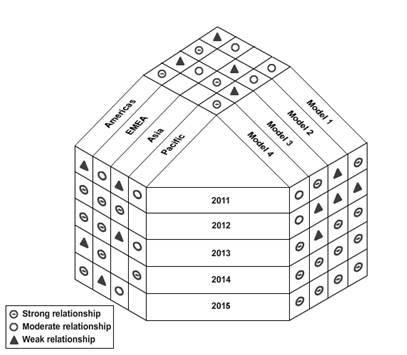
Fig: A Y-shaped matrix that summarizes the requirements for different models of photocopiers
The Y-shaped matrix is a matrix diagram that relates three sets of elements where one set is related to the other two sets in a circular manner. . It can be formed by bending the columns of sets A and B in the T-matrix in such a way that there is an interrelation between the elements of these two sets.

Tags
Matrix diagrams can be sorted into several types depending on the number of data sets being compared.
- L-shaped Relates two sets of elements to one another or a single set of elements to itself.
- T-shaped Relates three sets of elements where there is no relation between the two sets that are related to a common set.
- Y-shaped Relates three sets of elements where one set is related to the other two sets in a circular manner.

- C-shaped relates three sets of elements simultaneously.
- X-shaped relates four sets of elements.
- Roof-shaped relates one set of elements to itself.
Tags
A matrix diagram, also called a matrix chart, is a management and planning tool used for identifying relationships between two to four groups of elements or among elements in a single group. The elements in different groups are placed in rows and columns and relationships among them are analyzed by the team. Symbols indicating the strength of the relationships are then entered in the cell where the row and column of the two elements intersect. If there is no relationship, then it is left blank. Because matrix diagrams help you analyze data, they are also extensively used in the Measure and Analyze phases of the DMAIC methodology.
- Relationships among different sets of items by comparing them, especially many-to-many relationships among them instead of one-to-one relationships.
- The strength of the relationship between different sets of items qualitatively.
- And, the success of a process that generates one set of items from another set of items.
Tags
In the previous topic, you created a tree diagram. Key issues identified must also be sorted in the order of their importance. A prioritization matrix helps determine the order for dealing with different issues or selecting solutions according to their relative importance. In this topic, you will create a prioritization matrix to identify crucial issues that require immediate attention.
You must prioritize key issues identified according to their importance to determine which issues or solutions are the most critical and need to be addressed first. Using a prioritization matrix, you can determine such crucial areas where Six Sigma projects need be implemented to improve your business processes.
What are Prioritization Matrices?
A prioritization matrix is a tool used for determining the most important issues or solutions. This tool can be used for any prioritization activity. In a Six Sigma project, it can be used for filtering or prioritizing either causes or solutions. For example, the cause-and-effect matrix is a prioritization matrix used for prioritizing causes, while the criteria-based matrix is used for prioritizing solutions.
Whatever the matrix, the procedure used for prioritization is the same. The Six Sigma team identifies different criteria to be used for measuring different solutions. The relative importance of each criterion is determined and a numerical value indicating the weight of each criterion is entered in a column. Ratings are then assigned to the solutions against different criteria. The different solutions are scored against the identified criteria. Each rating is then multiplied by the criteria weights to obtain the weighted scores. The weighted scores are then added to find the cumulative value. The option with the highest total value is regarded as the option with the highest priority.
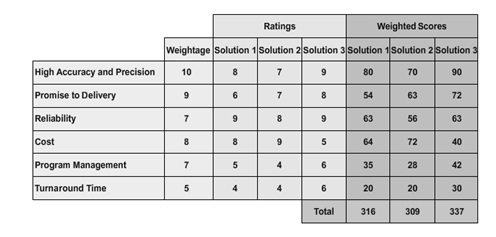
Fig: A sample prioritization matrix

What are the use of Prioritization Matrices?
- Prioritizing complex issues involving several criteria against which the issues are assessed.
- Assigning scores to the criteria or issues when data is available.
- Choosing key areas to be focused upon immediately.
- And, garnering team support and approval of crucial issues.
How to Create a Prioritization Matrix?
To create a prioritization matrix for determining key areas where Six Sigma projects need be implemented first:
- Gather the team members required to participate in the exercise.
- It is not necessary to limit the team to only the project team members.
- Involve all stakeholders who would have influence on the items to be prioritized.
- Ideally, the size of the team should be around eight.
- Agree upon the scope and the duration of the exercise because there is a tendency to drift from the main subject of interest, which may consume more time.
- Identify criteria against which the items to be prioritized can be weighed. Select the criteria according to your business and the nature of the process.
- Assign weights to the criteria on a scale of 1 to 10.
- Use an ascending scale while assigning the weight. Usually, the higher the better.
- Draw consensus within the team on the weights.
- Assign ratings for each item to be prioritized against different criteria on a scale of 1 to 10. Alternatively, the team can also pick solutions one by one and gather votes for each criterion. Members who agree that a solution fits a particular criterion vote for it. Ensure that necessary information is available to the team before voting.
- Compute the total score for each item.
- Multiply the rating for an item by the weight.
- Add the total scores for each item.
- Continue doing this for every criterion of all the items.
- Shortlist the items with higher scores for implementation.
Tags
Quality Function Deployment (QFD) is a structured approach followed by customer-driven organizations to transform customer requirements into their product specifications.
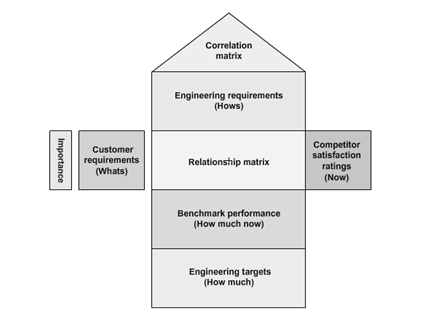
The House of Quality (HOQ) is a diagram used by a product development team during the initial stage of the QFD process.
It uses a planning matrix to define the relationship between customer requirements and the capability of the product and the company to satisfy these requirements. Because this matrix looks like a house, where customer requirements and product attributes resemble the main living quarters, competitive analysis resembles the porch, and the correlation matrix resembles the roof, it is called House of Quality.
HOQ encompasses different QFD elements used for understanding customer requirements and aligning business processes to meet these customer requirements.
It starts with customer requirements. The customers for a product or service are identified and their requirements from the product or service are gathered using different tools such as focus groups, surveys, and customer experiences. A structured list of customer requirements is then drawn by analyzing and organizing this data using tools such as affinity diagrams and tree diagrams.
Importance ratings are used for quantify the customer requirements and rated according to their importance on a scale of 1 to 5. This rating will be used in the relationship matrix at a later stage.
Another element is the Competitive analysis where customers views about the competition are gathered through research to provide a better understanding of the market. Here, the customers rate an organization’s products or services against competitors’ products or services. Also, Technical requirements that are not known to customers are identified and documented. These requirements generally stem from management or regulatory standards that a product must meet.

Relationship matrix defines the relationship between customer requirements and an organization’s ability to meet those requirements is determined. The relationship between the two factors is classified as weak, moderate, or strong and given the values of 1, 3, and 9, respectively. Even, in Importance weighting rating, Customer requirements are weighted according to their importance for defining and prioritizing key criteria. The relative importance of customer needs and the company’s and competitor’s performance are taken into account while calculating this. Target values for each product or service attributes, known as technical descriptors, that can be used as benchmarks against competitors’ target values are established. These target values are the “how much” of these product or service attributes.
The technical descriptors are compared with the competitors’ technical descriptors using scientific analytical techniques to assess their properties is called Engineering analysis. This also includes reverse engineering competitors’ products or services to determine the values for their technical descriptors. Correlation matrix is the relationship among customer requirements are analyzed to identify correlated requirements. The relationships are then ranked for determining areas of improvement that need to be focused upon.