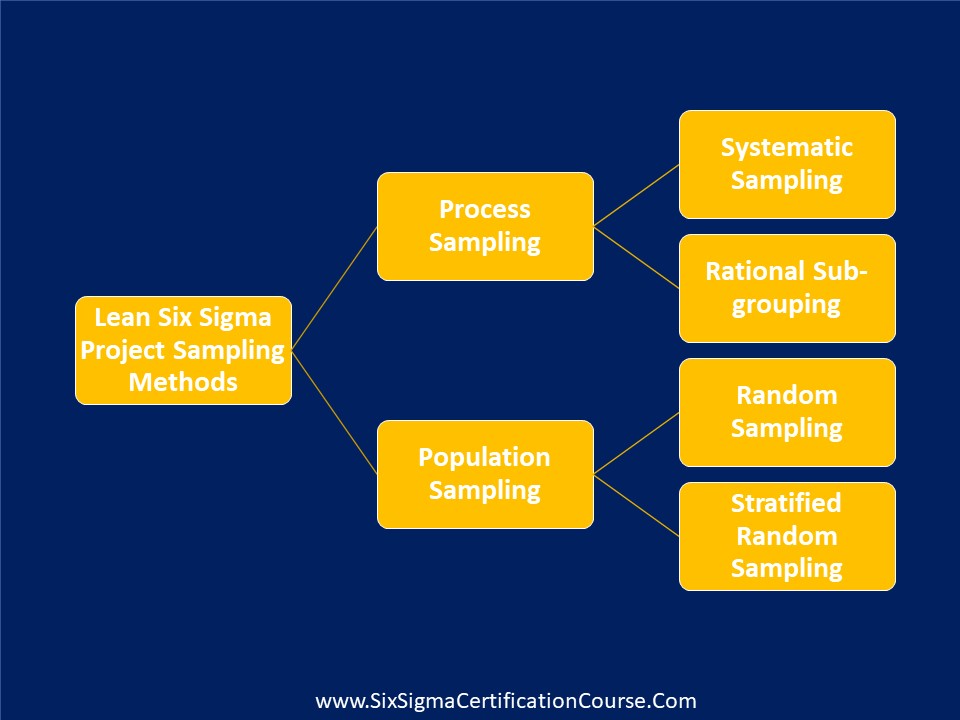
Selecting the Right Sampling Method for LSS Projects There are different reasons why you would go for sampling.If you are a Lean Six Sigma Green Belt or Lean Six Sigma Black Belt, or just an aspirant or a Quality Engineer, you will encounter several scenarios where you have to sample the data during data collection […]
Continue Reading
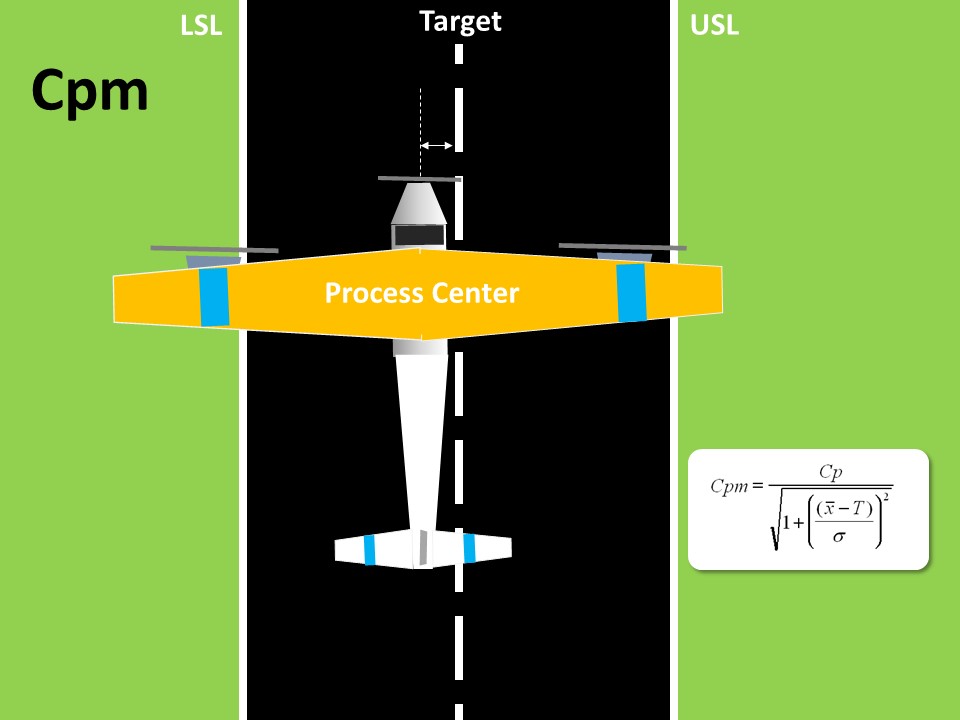
Cpm is yet another interesting process capability metric that is not very popular. In fact it is more robust than Cpk. Cpm is an advanced measure and it corrects some deficiencies in Cpk. It is also called as Taguchi Capability Measure. In order for us to understand Cpm, let’s take a step back and understand Cpk. […]
Continue Reading
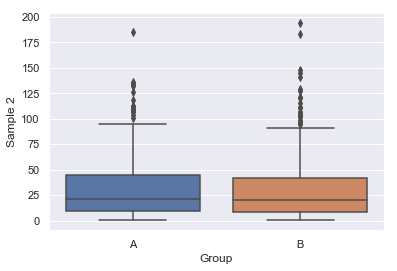
I’m sure you have heard of ‘Python’ in the context of Data Science and Analytics. Python is an object oriented high-level programming language with built-in data structures. If you are already a Certified Green Belt or a Black Belt from ASQ, IASSC or any other certification body, you might be familiar with a variety of […]
Continue Reading
Fig: A Y-shaped matrix that summarizes the requirements for different models of photocopiers The Y-shaped matrix is a matrix diagram that relates three sets of elements where one set is related to the other two sets in a circular manner. . It can be formed by bending the columns of sets A and B in […]
Continue Reading
Matrix diagrams can be sorted into several types depending on the number of data sets being compared. L-shaped Relates two sets of elements to one another or a single set of elements to itself. T-shaped Relates three sets of elements where there is no relation between the two sets that are related to a common […]
Continue Reading
A matrix diagram, also called a matrix chart, is a management and planning tool used for identifying relationships between two to four groups of elements or among elements in a single group. The elements in different groups are placed in rows and columns and relationships among them are analyzed by the team. Symbols indicating the […]
Continue Reading
An interrelationship digraph, also called a relations diagram or network diagram, is a tool that depicts relationships among different elements, areas, or processes through a network of boxes and arrows. It is usually used by Six Sigma teams to understand cause-and-effect relationships among different factors of a problem.
Continue Reading
A value-added activity is any activity that increases the worth of a product or service. It directly contributes to meeting customer requirements, and customers are willing to pay for it. Value-added activities also generate a positive ROI for an organization. Without these activities, the process will be affected. A lean team should analyze if activities […]
Continue Reading
Have you ever confronted a situation doing hard work the whole day and at the end you realize that most of the time had been given by you and your team to the Non Value Added things! One of the important aspects of the leadership in today’s competitive world is Prioritization. It helps to save […]
Continue Reading
There is no excerpt because this is a protected post.
Continue Reading
There is no excerpt because this is a protected post.
Continue Reading
There is no excerpt because this is a protected post.
Continue Reading
There is no excerpt because this is a protected post.
Continue Reading
There is no excerpt because this is a protected post.
Continue Reading