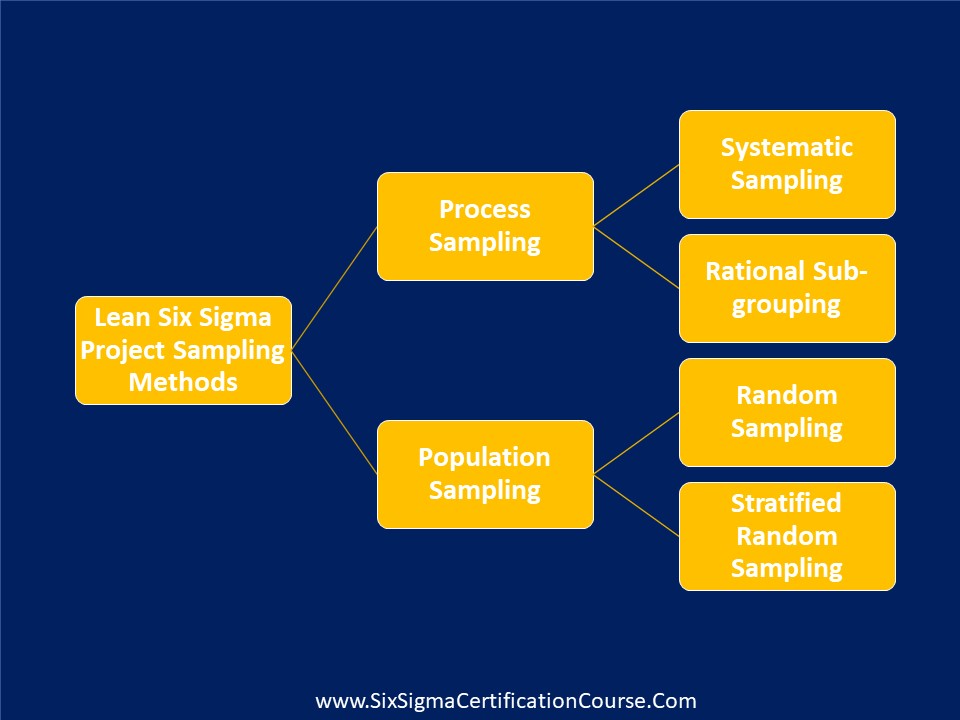
Data sampling is a crucial Six Sigma tool used to collect representative data from a larger population. It involves selecting a subset of data points that accurately reflect the entire dataset, enabling efficient analysis without the need for exhaustive data collection. By using techniques like random sampling, stratified sampling, and systematic sampling, organizations can ensure unbiased and reliable results. Data sampling helps in identifying trends, understanding process variations, and making informed decisions. It reduces the time and cost associated with data collection while maintaining the accuracy and integrity of the analysis, driving effective process improvements.
Measurement scales are crucial in Six Sigma as they provide a standardized way to quantify and analyze process performance. By using nominal, ordinal, interval, and ratio scales, Six Sigma practitioners can collect accurate data, identify variations, and implement improvements. These scales help in categorizing data, ranking variables, measuring intervals, and comparing ratios, ensuring precise and reliable data analysis. For instance, a ratio scale can be used to measure production defects per unit, enabling a clear understanding of the problem’s extent. Effective use of measurement scales ensures accurate data collection, leading to better decision-making and process optimization.
Process Value Analysis (PVA) is a Six Sigma tool used to evaluate and improve processes by identifying and eliminating non-value-added activities. By mapping out each step of a process and categorizing them as value-added, non-value-added, or necessary non-value-added, organizations can pinpoint inefficiencies and waste. This analysis helps prioritize improvement efforts on activities that enhance customer value and contribute to overall process efficiency. By focusing on value-added activities, PVA drives continuous improvement, reduces costs, and enhances product and service quality, ultimately leading to increased customer satisfaction and operational excellence.
A Process Flowchart is a Six Sigma tool that visually represents the steps, decisions, and flow of a process. By detailing each stage in a sequence, it helps identify inefficiencies, redundancies, and improvement opportunities. This tool enables clear communication of how a process works, making it easier to understand and analyze. Process flowcharts are instrumental in standardizing procedures, ensuring consistency, and improving overall process efficiency. They provide a foundation for process optimization, helping teams streamline operations, reduce errors, and enhance productivity. It’s an essential tool for visualizing and refining processes to achieve operational excellence.
A SIPOC diagram is a Six Sigma tool that provides a high-level overview of a process. It stands for Suppliers, Inputs, Process, Outputs, and Customers. This tool helps identify and clarify the key elements of a process by detailing the suppliers who provide inputs, the inputs themselves, the process steps, the outputs produced, and the customers who receive the outputs. By mapping out these components, organizations can better understand process boundaries, dependencies, and interactions, facilitating more effective process improvement and optimization. SIPOC diagrams are instrumental in ensuring alignment with customer requirements and enhancing overall process efficiency.
A Project Charter is a critical Six Sigma tool that formally authorizes a project, providing a clear roadmap for its execution. It outlines the project’s objectives, scope, stakeholders, deliverables, and overall plan. By defining these elements upfront, the Project Charter ensures that everyone involved understands the project’s goals and responsibilities, facilitating alignment and accountability. It serves as a foundational document for project planning, guiding decision-making and resource allocation throughout the project lifecycle. This clarity helps manage expectations, reduces risks, and increases the likelihood of project success by keeping the team focused and organized.
The Kano Model is a Six Sigma tool that classifies customer preferences into five categories: Must-be, One-dimensional, Attractive, Indifferent, and Reverse. By identifying which features fall into each category, organizations can prioritize product and service improvements that will most impact customer satisfaction. This model helps balance basic needs with delightful enhancements, ensuring that resources are allocated effectively. By understanding the different types of customer requirements, businesses can focus on developing features that will surprise and delight customers, ultimately leading to increased loyalty and competitive advantage. It’s a strategic approach to enhancing the customer experience.
Voice of Customer (VOC) is a vital Six Sigma tool that captures customers’ needs, expectations, and preferences through methods like surveys, interviews, and feedback. By systematically gathering and analyzing this data, businesses can identify key drivers of customer satisfaction and areas for improvement. VOC helps prioritize initiatives that directly address customer pain points and desires, ensuring that products and services are aligned with market demands. This customer-centric approach enhances decision-making, drives innovation, and fosters strong customer relationships, ultimately leading to increased loyalty and competitive advantage. It’s a cornerstone for achieving and maintaining high-quality standards.
A Project Selection Matrix is a valuable Six Sigma tool for prioritizing projects based on their potential impact and alignment with strategic goals. By evaluating projects against criteria such as feasibility, cost, benefits, and risk, it ensures that resources are allocated to the most promising initiatives. This matrix helps organizations focus on projects that provide the greatest value, streamline efforts, and drive continuous improvement. It promotes data-driven decision-making and enhances overall project management efficiency, ensuring that efforts are concentrated on initiatives with the highest potential for success and impact
A Pareto diagram, a key Six Sigma tool, visualizes the 80/20 rule: 80% of problems stem from 20% of causes. By displaying data in descending order, it highlights the most significant issues. Businesses use this to prioritize improvements, targeting the root causes with the biggest impact first. This approach enhances efficiency, reduces costs, and improves quality. In essence, the Pareto diagram helps organizations focus their efforts where they matter most, driving more effective problem-solving and decision-making. It’s a straightforward yet powerful tool for continuous improvement and operational excellence.
How to Gather Customer Data through a questionnaire?
Let us learn how to gather customer data. A well-defined goals are the best way to assure a good questionnaire design. When the goals of a study can be expressed in a few clear and concise sentences, the design of the questionnaire becomes considerably easier.
To effectively conduct a customer survey through a questionnaire, follow these guidelines:
Keep your questionnaire short because long questionnaires get fewer responses when compared to short questionnaires.
Include experts and relevant decision makers in the questionnaire design process.
Formulate a plan for doing the statistical analysis during the design stage of the project.
Questionnaires reflect first impressions. The respondents first impressions come from the cover letter. Provide a well-written cover letter.
Give your questionnaire a title that is short and meaningful to the respondents.
Include clear and concise instructions on how to complete the questionnaire.
Use short sentences and basic vocabulary.
Begin with a few interesting items. If the first items are too boring, there is little chance that the questionnaire will be completed.
Use simple and direct language in the questions so they are clearly understood by the respondents.
Leave adequate space for respondents to make comments. One criticism of questionnaires is their inability to retain the connotation of responses.
Place the most important items in the first half of the questionnaire.
Hold the respondents’ interest. One way to keep a questionnaire interesting is to use a variety of questions.
Provide incentives as a motivation for a properly completed questionnaire.
Make it convenient. The easier the questionnaire, the better the response.
Use professional production methods for the questionnaire, such as desktop publishing.
The final test of a questionnaire is to try it on representatives of the target audience to identify any problem areas.
A Six Sigma team uses a number of tools in the Define phase to identify and define problem areas or opportunities for improvement. The tools include:
Project charter is a document that provides a clear, concise description of the business needs that a project is intended to address. It not only makes a project official, but also gives Yellow Belts, Green Belts, or Black Belts the authority to lead the project and draw on organizational resources as needed. The project charter documents the expected results.
SIPOC diagram is a high-levelprocess map that is used to identify and define all the relevant elements that are necessary for improving a process before actual work begins. It is an acronym of these elements: Suppliers, Inputs, Processes, Outputs, and Customers. The SIPOC diagram helps process improvement teams understand the purpose and the scope of a process before they begin to measure or improve it. It is also called COPIS to emphasize that the entire process starts with customers. COPIS is an acronym of Customers, Outputs, Processes, Inputs, and Suppliers.
Affinity diagram is a diagram that is used to organize different ideas that are generated in brainstorming sessions into meaningful groups.
Multi-Generational Planning (MGP) is an approach that breaks projects into manageable phases. Each phase is called a generation, and therefore the approach is called MGP. Breaking down projects logically and rolling them out in a phased manner helps the process development team envision the various stages of a product or service. In the evolution of products or services, different functionalities are added several times in each phase of MGP. MGP helps you manage project scopes better in process improvement projects.
Stakeholder analysis is an analysis used by quality improvement teams for identifying and evaluating people who will influence the outcome of a project to ensure that their interests are addressed. Knowing the effect that stakeholders will have on a project also helps in anticipating potential problems and devising strategies to handle them effectively.
Communication plan is a written document that describes how different stakeholders and interested parties will be informed about the objectives of a project, the means of accomplishing these objectives, the tools to be used, improvements, solutions and how they impact stakeholders, project benefits, progress made, and the timeline.
VOC analysis is used to understand customer requirements so that an organization can provide products and services that meet these requirements. It delivers products and services that satisfy customers that helps organizations survive in a highly competitive market.
Kano analysis is an analysis that measures the extent to which a product or service satisfies the requirements and expectations of customers. In other words, it defines the customers’ requirement priorities. Professor Noriaki Kano developed Kano analysis, as it was named after him. The Kano model classifies product attributes based on how they are perceived by customers. It classifies customer requirements as mandatory requirements and delights. These classifications are useful for a customer-driven organization to make design decisions on its product.
Quality Function Deployment (QFD)is a structured approach followed by customer-driven organizations to transform customer requirements into product specifications. QFD provides an insight into the whole design of a product, thereby eliminating production problems that may arise during manufacturing.
RACI matrix is a tool used for clarifying roles, responsibilities, and authority in teams involved in a business process task. RACI is an acronym of the four responsibilities used, namely Responsible, Accountable, Consulted, and Informed.
Project prioritization matrix is a tool used during brainstorming sessions for evaluating various issues against different criteria and prioritizing the issues. This helps identify issues that must be solved first to eliminate problems and improve processes.
Pareto chart is a bar chart that displays various categories of problems in a project by the frequency of their occurrence. It is named after its creator, Vilfredo Pareto, a 19th century economist. The objective of using a Pareto chart is to narrow down the primary causes of problems and focus efforts on tackling the most important causes. The Pareto chart is also known as the 80-20 chart.
These tools are used during the Define phase to understand selected projects better.
Both DFMEA and PFMEA have similar principles and follow identical steps. Both involve identifying potential failures, their impact, and corrective measures to be taken for reducing or eliminating these potential failures.
However, DFMEA and PFMEA differ in a few aspects, such as their focus and the stage in which these two analyses are done.
DFMEA focuses on potential failures related to product design changes. The main focus is on finding potential failures that can result in malfunctions and safety hazards while using the product. It is also applied to identify potential causes that may curtail the life of the product. It must be conducted throughout the entire design process, starting at the preliminary design as soon as the design concept has been selected to the production.
PFMEAfocus on potential failures associated with processes and changes to them. The main focus is on finding potential failures related to a process that can affect the quality of a product or cause safety or environmental hazards and result in customer dissatisfaction. It is also applied to identify potential causes that reduce the reliability of the process.
Item
Description
Focus
DFMEA: On potential failures related to product design changes
PFMEA: On potential failures associated with processes and changes to them
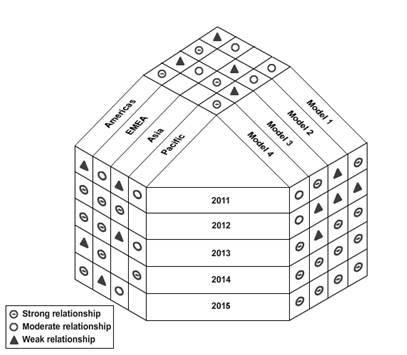
Fig: A Y-shaped matrix that summarizes the requirements for different models of photocopiers
The Y-shaped matrixis a matrix diagram that relates three sets of elements where one set is related to the other two sets in a circular manner. . It can be formed by bending the columns of sets A and B in the T-matrix in such a way that there is an interrelation between the elements of these two sets.